Improve this page
Online help of the
JavaMelody monitoring
The JavaMelody monitoring is a tool to measure and calculate statistics on real operation of an application
depending on the usage of the application by users.
The monitoring is mainly based on statistics of requests and on evolution charts.
It allows to improve applications in QA and production and helps to:
- give facts about the average response times and number of executions
- make decisions when trends are bad, before problems become too serious
- optimize based on the more limiting response times
- find the root causes of response times
- verify the real improvement after optimizations
 JavaMelody Project
Home page
Downloads
Release notes
 Documentations
Java SE documentations
Java SE Platform at a Glance
Troubleshooting Guide for Java SE 8
Monitoring and Management for Java SE 8
Java SE 6 Performance
Summary
In the page of monitoring, the summary shows evolution charts for several values of measures.
These measures are taken at a time T, for example every minute.
Each chart follows the evolution of a value of measure on the period short or large chosen
with the links above the summary:  the day,
 the week,
 the month,
 the year or
a custom period.
In each chart, the mean value in green and the maximum in blue are displayed with numbers below the chart.
And in the zoomed charts the 95th percentile line is displayed in magenta.
It shows what would be the maximum on the period if 5% of the highest values (short peaks) were excluded.
The units in the charts are chosen based on the values: "m" is for milli (1 / 1000), "k" is for kilo/thousands,
"M" is for mega/millions, "G" is for giga/billions and "u" is for micro (1 / 1000000).
Charts are persisted: a restart of the application server has no influence on them except of a hole in the measures.
the year or
a custom period.
In each chart, the mean value in green and the maximum in blue are displayed with numbers below the chart.
And in the zoomed charts the 95th percentile line is displayed in magenta.
It shows what would be the maximum on the period if 5% of the highest values (short peaks) were excluded.
The units in the charts are chosen based on the values: "m" is for milli (1 / 1000), "k" is for kilo/thousands,
"M" is for mega/millions, "G" is for giga/billions and "u" is for micro (1 / 1000000).
Charts are persisted: a restart of the application server has no influence on them except of a hole in the measures.
Each chart can be zoomed and resized by clicking on them in the summary.
The charts displayed are:
- the java memory used, between 0 and the maximum set by Xmx in the server configuration
- the cpu percentage used by the java process, between 0 and 100 even if there are several cores or several processors
- the number of http sessions (or number of connected users)
- the number of active threads (or number of current http requests)
- the number of active jdbc connections (or number of current sql requests)
- the number of used jdbc connections (or number of opened sql transactions);
in the case where there is no datasource, it is in fact the number of opened jdbc connections in the connection pool
- for each counter of requests (http, sql and possibly ejb, spring, guice, jsf actions, struts actions, jsp pages) :
- the number of hits per minute (or number of executions of requests per minute)
- the mean time in milliseconds
- the percentage of system errors
(these values for a counter are a mean for the last period of measure)
- and also in 'Other charts', some data which are global for the JVM or for the OS:
- if Tomcat or JBoss, the number of active threads in all the server, the number of bytes received
per minute and the number of bytes sent per minute by the server (the number of bytes received is
often 0 for most webapps)
- the cpu percentage of the garbage collector for the JVM
- the number of threads for the JVM
- the number of loaded classes for the JVM
- the used buffered memory
(direct
and mapped buffers)
- the used non heap memory for the JVM
- the used physical memory for the OS
- the used swap space for the OS
- the cpu percentage used by the whole OS
- the mean age of the currently valid http sessions in minutes
- if linux: the system load and the number of opened files for the OS
- the transactions per minute (more precisely, the number of opened jdbc connections per minute)
The hours in the graphics for the day depend on the time of the server and of the timezone of the server
(as defined by the OS or specifically for the application server).
The link ' Update' refreshes the page and the charts.
The link '
Update' refreshes the page and the charts.
The link ' PDF' displays the report in PDF format for Adobe Reader.
If a collect server is used to display the monitoring of several servers in a farm or in a cluster,
the chart of the memory is the sum of the memories in each server,
but the cpu percentage is between 0 and 100 for all servers,
and the number of http sessions is the sum of sessions in each server,
as are the number of active threads, the number of active or used jdbc connections,
and the number of hits per minute or the mean time in milliseconds.
Memory chart: use case of an application used intermittently (day/night for example)
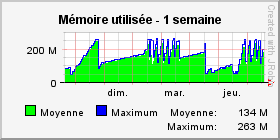
The memory in the chart increases rapidly when the application is used,
and it increases slowly but still increases when the application is not used.
A chart with slopes, as in the above example, is classic even if the application is not used.
In all cases and as needed, the memory is finally released at once by the garbage collector
(major GC) and goes to a low level, before rising again rapidly or slowly.
If the resolution set is sufficiently fine, the chart also shows the minor GCs
as small sawtooth between the major GCs.
These minor GCs release also some memory but in less quantity than the major GCs.
It is possible to force a major GC with the action
' Execute the garbage collector'
in the part '
Execute the garbage collector'
in the part ' System informations' of the report.
Memory chart: use case of a memory saturation
If the memory in the chart increases to the maximum and if the application can not release some of it with the garbage collector,
the server possibly causes some "OutOfMemoryErrors: Java heap space" to interrupt the execution and to release some memory if possible.
Until the memory is sufficient, the cpu remains at 100% because the garbage collector runs permanently.
This can cause extreme slowness or a blocking of the application server.
The solutions can be to increase the maximum java memory (parameter Xmx in configuration of server),
and possibly the physical memory of the server, or to optimize if possible the memory used by the application.
Perm Gen memory: use case of a perm gen saturation
If the value of the perm gen memory increases to the maximum and if the application can not release some of it,
the server possibly causes some "OutOfMemoryErrors: PermGen space" to interrupt the execution.
This can block all features in your application.
The solutions can be to increase the maximum PermGen memory (parameter XX:MaxPermSize in configuration of server, 64 MB by default),
and possibly the physical memory of the server, or to reduce if possible the number of classes loaded by the application.
Charts of active threads and of active jdbc connections: use case of a flat level (long requests)

When an application is sparsely or not used, the charts of active threads and of active jdbc connections stay at 0.
Indeed, most requests are fortunately short and most measures (done each 2 minutes for example)
are taken without active requests, except 1 or 2 occasionally shown as a peak.
But, when there is a flat level in the chart of active threads as in the example above,
this means that there is one or several requests which are long (several minutes or several hours)
and which potentially saturate the application server or the database.
To find the cause:
- If the flat level of active threads is reproduced exactly in active jdbc connections,
this shows that the cause is in one or several sql request(s) and not in the execution of java code.
- If the flat level(s) continues currently, you can find the http (and sql) requests involved
in the '
 Current requests' part of the report.
- If the flat level(s) has ended, you can find the statistics of http (and sql) requests involved,
in the detailed tables of '
 Http (and sql) statistics',
except if the application server has been stopped before the end of these requests.
Http (and sql) statistics',
except if the application server has been stopped before the end of these requests.
- The drill-down display in the detail of an http request can help you to find the root cause in the façades or the sql requests.
- If an Oracle database is used, the display of the execution plan in the detail of the sql request can help you to find the cause of the time of this request
(if the display of the execution plan says that a table "plan_table" must be created:
you can use the script @$ORACLE_HOME/rdbms/admin/catplan.sql as user SYS if v10g or above
and otherwise @$ORACLE_HOME/rdbms/admin/utlxplan.sql and "grant all on plan_table to public" if v9i or less).
- It can be useful to check with the monitoring the state of the memory and the cpu used by the application server.
It can also be useful to check by yourself the state of the memory, of the cpu and of disk access of your database.
Charts of used jdbc connections : use case of a jdbc connections leak
In general, the jdbc connections are shared in a connection pool with a jdbc datasource,
which allows in particular not to reopen the connections to the database
data continuously and which can also define a maximum number of transactions
which can run simultaneously per instance of the application server.
It is possible in JavaMelody to view the 2 charts of active jdbc connections and
used jdbc connections.
The chart of active jdbc connections shows the number of connections running sql queries.
And the chart of used jdbc connections shows the number of opened connections which are used in
transactions with the database but not necessarily executing sql queries.
If ever the monitored application contains a leak of jdbc connections in some particular
conditions, then connections are used unnecessarily and remain unavailable outside the
connection pool. The chart of used connections may show that their number increases
without decreasing to the minimum configured in the connection pool of the datasource
even if the server has no activity, at night for example. At the maximum, errors are thrown
in the connections pool because there is no more available connection.
If a leak of jdbc connections is suspected, times and stack traces showing where
connections have been opened can be displayed by the link
' Opened jdbc connections'
in the ' System informations' part of the report.
(This link is available if the parameter 'system-actions-enabled' has been set to 'true').
Careful reading of the code for these stack traces will confirm or not the jdbc connections leak.
Opened jdbc connections'
in the ' System informations' part of the report.
(This link is available if the parameter 'system-actions-enabled' has been set to 'true').
Careful reading of the code for these stack traces will confirm or not the jdbc connections leak.
The chart of used jdbc connections and the stack traces of openings are of little use
if a connection pool is used directly with a JDBC driver and without a datasource, because in this
case you visualize with this chart and these stack traces only the openings
of connections by the pool and not the real uses of these connections by the application.
Statistics
The statistics of a counter show the statistics of the requests executed on the application server.
8 counters of requests exist today:
-
Http statistics
-
Sql statistics (jdbc)
-
Jpa statistics
 Ejb statistics (if ejb3 façades on JavaEE 5+)
-
Spring statistics (if spring façades)
-
Guice statistics (if guice façades)
-
Statistics of façades interfaces (without ejb3, spring or guice)
 Statistics of jsf actions
 Statistics of struts actions
-
Statistics of rendering with jsp pages (or more precisely, of executions of include or forward on httpServletRequest.getRequestDispatcher, which are the jsp pages in general)
For each counter, a request appears in the statistics when it is finished;
to know the unfinished requests see the
' Current requests' part of the report.
As for the charts, the statistics of requests are for the period small or large chosen with the
links above the charts: the day (from 0h), the week, the month or the year.
So it is possible to see the statistics for only the current day, or for example for a version
of the application deployed for a month without the statistics of previous versions.
And for each counter, the report shows a summary of statistics for all the requests (global),
of the statistics going beyond the threshold of alert level 1 (warning)
and of those going beyond the threshold of alert level 2 (severe).
The details of the statistics for each request are displayed by clicking the link '+ Details'.
Each statistic of request shows:
- the content of the request
- an evolution chart for mean times of this request in tooltip for the same period as the statistics;
this chart can be zoomed by clicking on the content of the request
- the percentage of cumulative time (mean time * nb of hits) compared to other requests
- the number of hits (or number of executions)
- the mean time in milliseconds
- the maximum time in milliseconds
- the standard deviation between execution times:
if it is high, the execution times are varied, and if it is low the execution times are closed to one another
- the percentage of cumulative cpu time (mean cpu time * nb of hits) compared to other requests
- the mean cpu time in milliseconds
- the mean number of allocated Kb, that is the memory used per request and which will have to be cleaned by the GC later
- the percentage of system errors
and if it is an http, ejb, spring, guice, interfaces, jsf actions, struts actions or jsp statistic:
- the mean size in kilo-bytes of the response stream (only for http)
- the mean number of sql hits, by execution of http(, ejb...) request
- the mean time executing sql requests, by execution of http(, ejb...) request
The mean times, the maximum times and the mean cpu times are cumulative: for example, the http mean times include
the ejb mean times and the sql mean times ; moreover the http mean cpu times include the ejb mean cpu time and the sql mean cpu times.
But wait times like sleeping or waiting for I/O do not consume cpu, so they are included in mean times but not in mean cpu times.
Like all tables of the report, the tables of statistics can be ordered in ascending or descending order by clicking on headers of columns.
The statistics are persisted for each counter: a restart of the application server has no influence on them.
If a collect server is used to display the monitoring of several servers in a farm or in a cluster,
the statistics of counters are global for all servers.
 Statistics of http system errors
The statistics of http system errors show the errors which come back to the http filter of the
monitoring, either by exceptions thrown by the application via a servlet,
either by an http error code (404 "not found" or 500 "internal server error" for example,
complete list).
These statistics display the list of the 250 most frequent system errors with the number of cases
of each error on the chosen period, and with the mean time of the request for each error.
Only the most frequent error is displayed initially, the other errors being displayed by clicking the link '+ Details'.
The dates, hours, users and complete http requests of the last 100 errors are displayed by clicking the link '+ Last errors'.
By clicking on the name of an error, it is possible to see its java stack-trace when it is a java exception.
These statistics of errors allow to improve the reliability of the application based on its real usage in production.
 Statistics of system error logs
The statistics of system error logs show the 'warning' and 'error' logs written by the application
(the libraries log4j of apache, logback and java.util.logging of the jdk are supported).
These statistics display the list of the 500 most frequent error logs with the number of
cases of each error on the chosen period.
Only the most frequent error log is displayed initially, the other logs being displayed by clicking the link '+ Details'.
The dates, hours, users and where appropriate the complete http requests of the last 100 error logs
are displayed by clicking the link '+ Last errors'.
By clicking on the name of an error log, it is possible to see for this log the java stack-trace of
the error when a java exception has been written in the log.
These statistics of error logs allow equally to improve the reliability of the application
based on its real usage in production.
Current requests
The current requests show at the moment of the generation of the report the executions of not ended requests.
The tree of http requests, possibly ejb, spring and/or sql is displayed with for each of the requests,
the time already elapsed, the cpu time elapsed, the number of sql requests already executed and the sql time of these requests.
The global statistics of the requests are displayed again for the current requests:
mean time, mean cpu time, mean sql hits and mean sql time.
It allows to compare the current requests with the global statistics.
The current java stack-trace is displayed by a tooltip on the thread.
Only the longest request is displayed initially, the others are displayed by clicking on the link '+ Details'.
System information
The system information displays at the moment of the generation of the report some information on the java server,
on its state and on the operating system of the server.
The main information displayed initially is:
used java memory, number of http sessions, number of active threads, number of active jdbc connections
and number of used jdbc connnections.
These are the same values which are used for the charts.
The other information, such as the version of the server, of the operating system or of the database
or the memory of the operating system, is displayed by clicking on the links '+ Details'.
In this part of the system information, some links allow to run the system actions:
-
'Execute the garbage collector', to force a release of memory
 'Generate a heap dump',
to dump all the content of the memory in a file of the temporary directory on the server,
which you can open with VisualVM of the JDK
or with Eclipse MAT
'Generate a heap dump',
to dump all the content of the memory in a file of the temporary directory on the server,
which you can open with VisualVM of the JDK
or with Eclipse MAT 'View memory histogram', to display the number of instances in memory for each java class
 'Invalidate http sessions', to force all users to disconnect
 'View http sessions', to see the attributes, the serialized sizes
(generally higher than the sizes in memory), the country and possibly the user of each session
(if authentication by JavaEE)
'View http sessions', to see the attributes, the serialized sizes
(generally higher than the sizes in memory), the country and possibly the user of each session
(if authentication by JavaEE) 'View deployment descriptor': web.xml file of the application
 'MBeans': management beans like in jconsole or jvisualvm,
with some configuration and technical data on the application server and on the JVM.
The values are viewable but not writable and operations can not be performed.
'MBeans': management beans like in jconsole or jvisualvm,
with some configuration and technical data on the application server and on the JVM.
The values are viewable but not writable and operations can not be performed. 'View OS processes': list of processes of the operating system (linux with
ps or windows with tasklist)
and for each process: user, memory and cpu
'View OS processes': list of processes of the operating system (linux with
ps or windows with tasklist)
and for each process: user, memory and cpu 'JNDI tree': Browse the JNDI context, for example to find the path and name of a JDBC datasource.
-
'Spring beans' : List of Spring beans.
-
To help find a possible jdbc connection leak, the 'opened jdbc connections'
shows the list of the stack traces of where were opened jdbc connections.
-
'Database': Information and statistics on the database (if PostgreSQL, MySQL, Oracle, DB2, Sybase or H2),
like for example the current sql requests or if oracle, the longest requests in cumulative time with
display of the cpu time and of the elementary cost (of buffer gets).
This function will display an error if the user configured in the application to connect to the
database does not have the necessary rights. With oracle, the following request grants this right:
"grant select any dictionary to myuser".
If a collect server is used to display the monitoring of several servers in a farm or in a cluster,
the system information of each server is displayed (aggregated for the list of sessions and for
the memory histogram) and the actions are executed on each server one at a time.
 Threads
This table displays the list of all the threads in the server, with for each the priority, the state
and the stack-trace in a tooltip, among other.
 Caches of data
The caches of data display the list of caches in the java application provided that the library
ehcache is used for them.
For each of the caches, some statistics are displayed:
the number of objects in memory and on disk at the moment, the efficiency of the memory cache
(percentage since the start of the server of the memory cache hits compared to the disk cache hits),
the global cache efficiency (percentage of the memory cache or disk cache hits compared to all cache access
including misses for data not in cache) depending on the ehcache version.
The configuration of each cache is also displayed for information.
Since ehcache v2.1, the caches statistics are not enabled by default.
So you need to enable them by adding statistics="true" in all the configurations of the caches, in order to display the efficiency values of the caches.
A button is available to clear all caches.
 Jobs
Jobs
The jobs display the list of tasks (or batchs) in the java application provided that the library
quartz is used for them.
For each job, mean time, last error with stack-trace for the selected period,
and the previous and next execution times are displayed.
Like with http requests, the statistics for jobs are displayed with mean times, mean cpu times,
sql hits and sql times for the selected period.
Buttons are available to pause or to resume each or all jobs.
If you have quartz jobs scheduled with Spring but you don't see any job in the report,
have you added the property "exposeSchedulerInRepository" as said in the user's guide?
Language
The monitoring is displayed in French or in English depending on the preferred language in your browser.
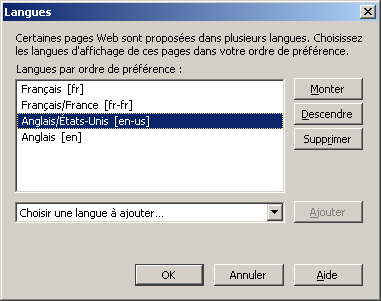
If the monitoring is in French instead of being in English, you should modify the preferred language.
For example, in Firefox,
open the menu and popup "Tools, Options, Content, Language ... Choose" and move "Anglais [en]" to the first place:
External API
The external API gives you access to some data, as XML or JSON for example. Try it in the api page.
Desktop
The monitoring reports can be displayed in a "Desktop" application.
This application is started by a click on the link "Desktop", at the top of the monitoring page, and it uses JavaWebStart and the local JRE.
But the application is auto-signed, so it must be authorized before by adding the download site in the exceptions of JavaWebStart.
For this, click : "Start menu, Java, Configure Java, Security, Edit site list, then copy and paste
https://github.com/javamelody/javamelody and OK".
More information : Oracle documentation.
Icons credits
Silk, mini and flag icons (Creative Commons)
Tango icons (GPL)